 iMyList – Edit Chart
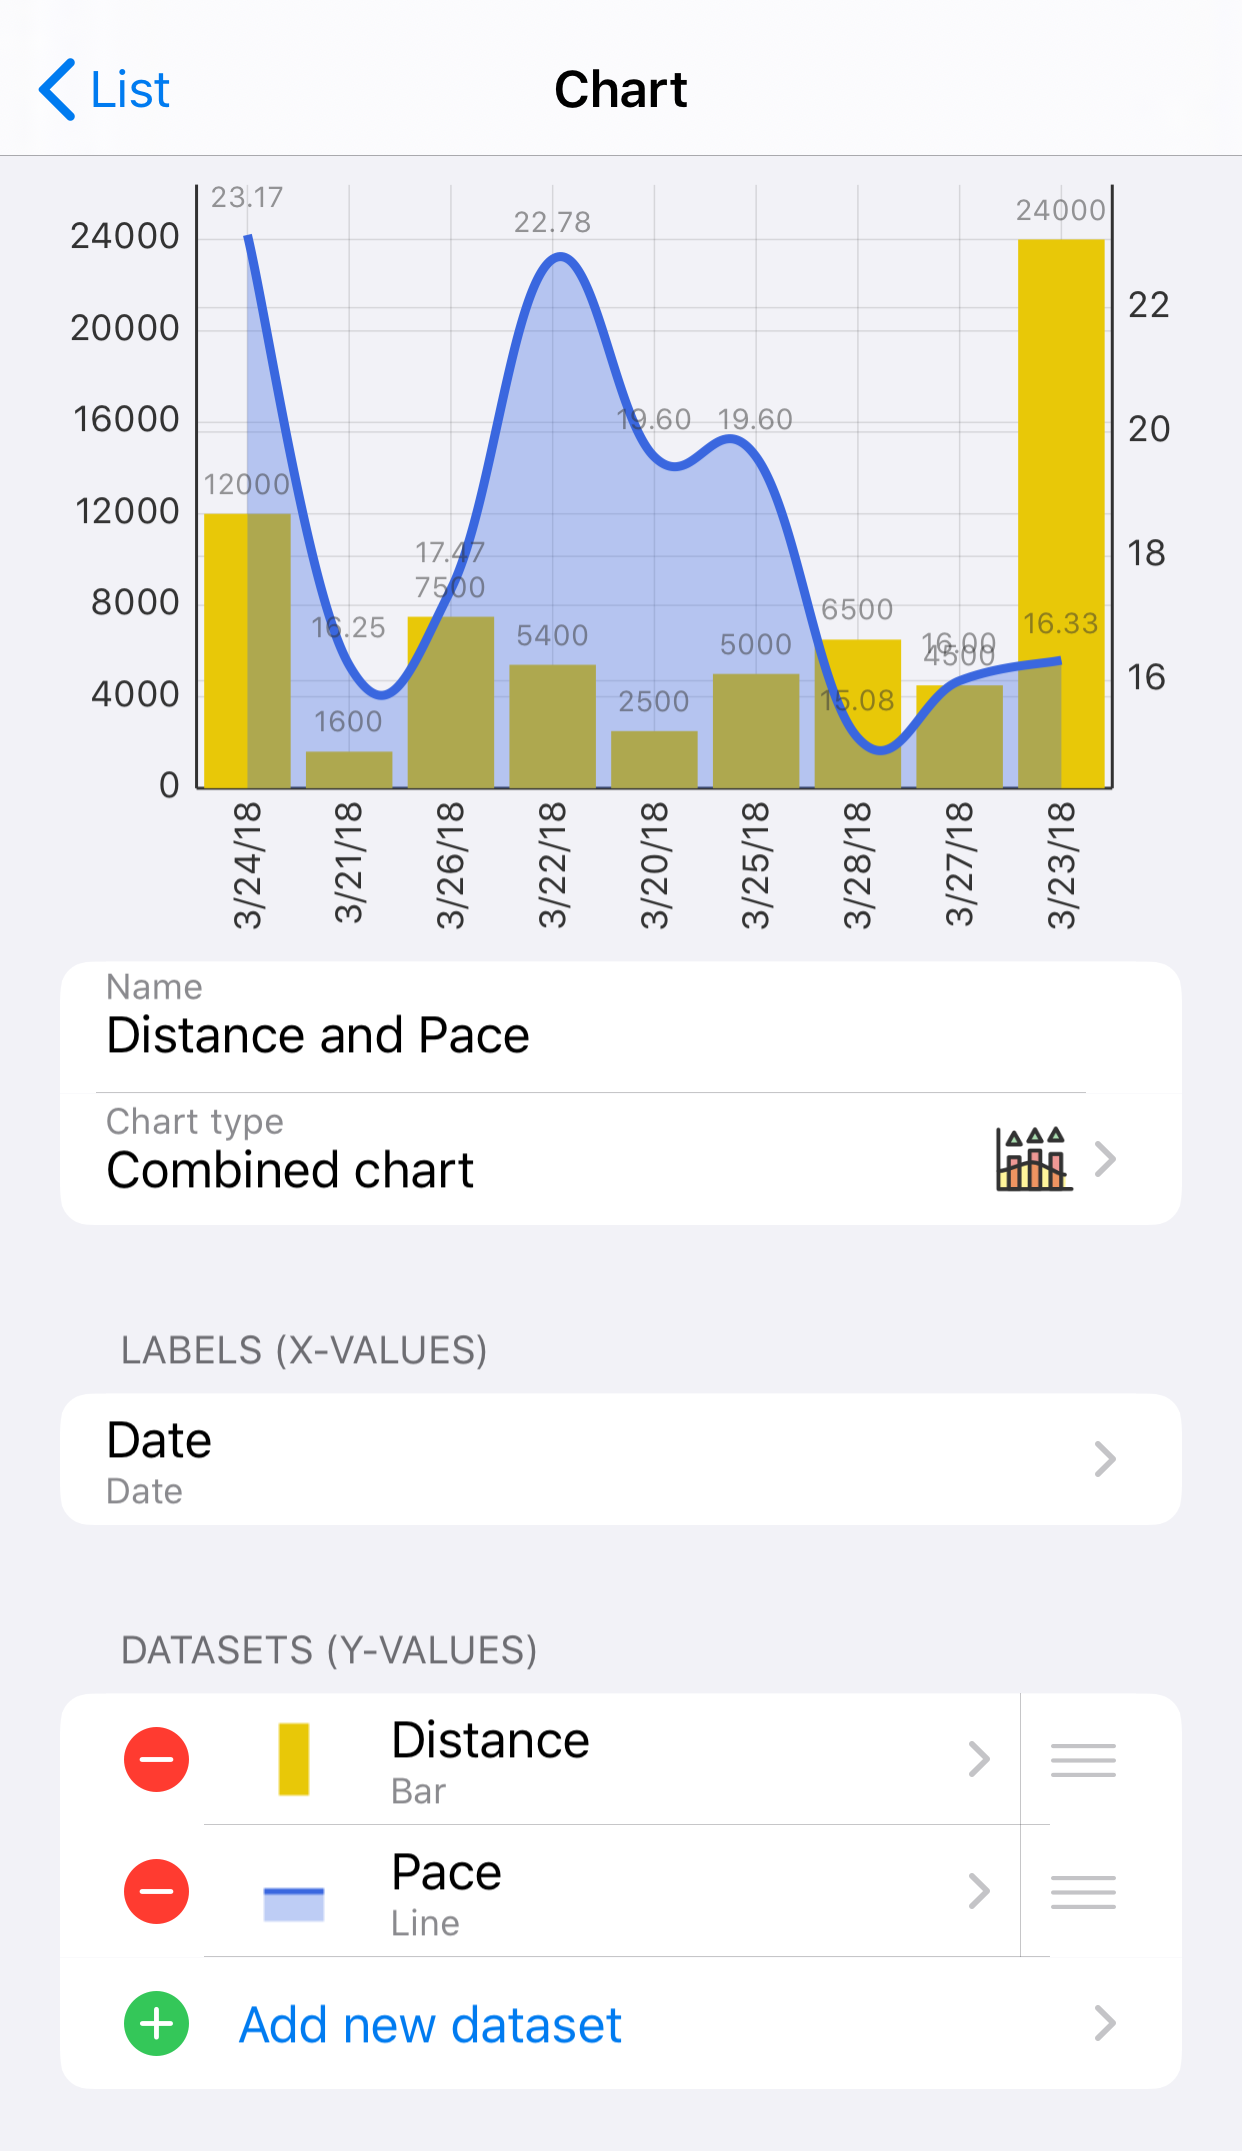
In the Edit Chart view you edit all properties for a chart.
- Tap on the chart name or Add New Chart field in the Edit List view to edit a chart.
- Tap the Name field to enter a name for the chart. Empty names are allowed. The name is displayed as the header in the Chart view.
- Tap the Chart type field to select the type of the chart. You can select one of the following:
 Bar chart – values are drawn as vertical bars. Multiple datasets are placed next to each other as separate bars in a group.
 Stacked bar chart – values are drawn as vertical bars. Multiple datasets are stacked on top of each other in the same bar.
 Horizontal bar chart – values are drawn as horizontal bars. Multiple datasets are placed next to each other as separate bars in a group.
 Line chart – values are drawn as lines.
 Scatter chart – values are drawn as points of a specified shape.
 Bubble chart – values are drawn as bubbles with different sizes, defined by two different values for each bubble: the y value and size.
 Candle chart – values are drawn as candle shapes, defined by four separate values for each candle: open, close, high, and low. This is normally used for stocks and related financial data.
 Combined chart – values are drawn as bars, lines, scatter points, bubbles, and candles as specified for each dataset. Different types are displayed in combination in the same diagram.
 Pie chart – values are drawn as pie or circle segments.
 Radar chart – values are drawn as polylines around a center point, like a radar display.
- Tap the entry in the Labels section to select a column for the x axis values in the chart.
- Add datasets to the chart by tapping on Add new dataset in the Datasets section. The Edit Dataset view is displayed where you edit the dataset properties.